Introduction
In a recent Power BI sales project, I needed to calculate the final price for each order after applying multiple discounts. At first, I tried a “row-by-row” approach, but I quickly realized it was complicated and had poor performance. After looking into other options, I found a simple and efficient way to calculate a series of discounts in Power Query by multiplying the discount factors together. This method avoids calculating prices step by step and doesn’t require referencing previous rows.
This method is not limited to discounts, it works well in other situations where you apply several percentage changes one after the other. For example, it can be used for things like adding multiple taxes or fees, calculating interest over time, etc. Instead of doing the math step by step, you just multiply all the parts together, which makes it easier and faster to do in Power Query.
The sample data and report used in this post can be found in this GitHub repo under Posts -> Chain discount.
Problem description
The sample data is shown below in Image 1 and Image 2. The sales table contains order numbers and the original price for each order, with one unique row per order. The discounts table lists all the discounts that apply to each order.
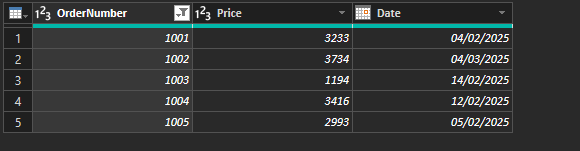
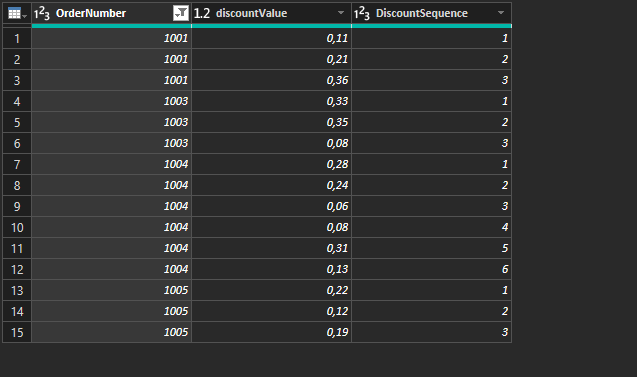
Take order 1001 as an example. Its initial price is 3 233 € and it has three discounts:


Where 


A straightforward, “row‑by‑row” way to calculate the final price is:


For order 1001 
Turning the chain into one formula
Start by substituting 


The same for

Generalising to n discounts gives:

Or we can use the “fancy” capital Pi notation to represent the product of the sequence of discounts:

For order 1001 this is


which matches the row‑by‑row result.
Power Query
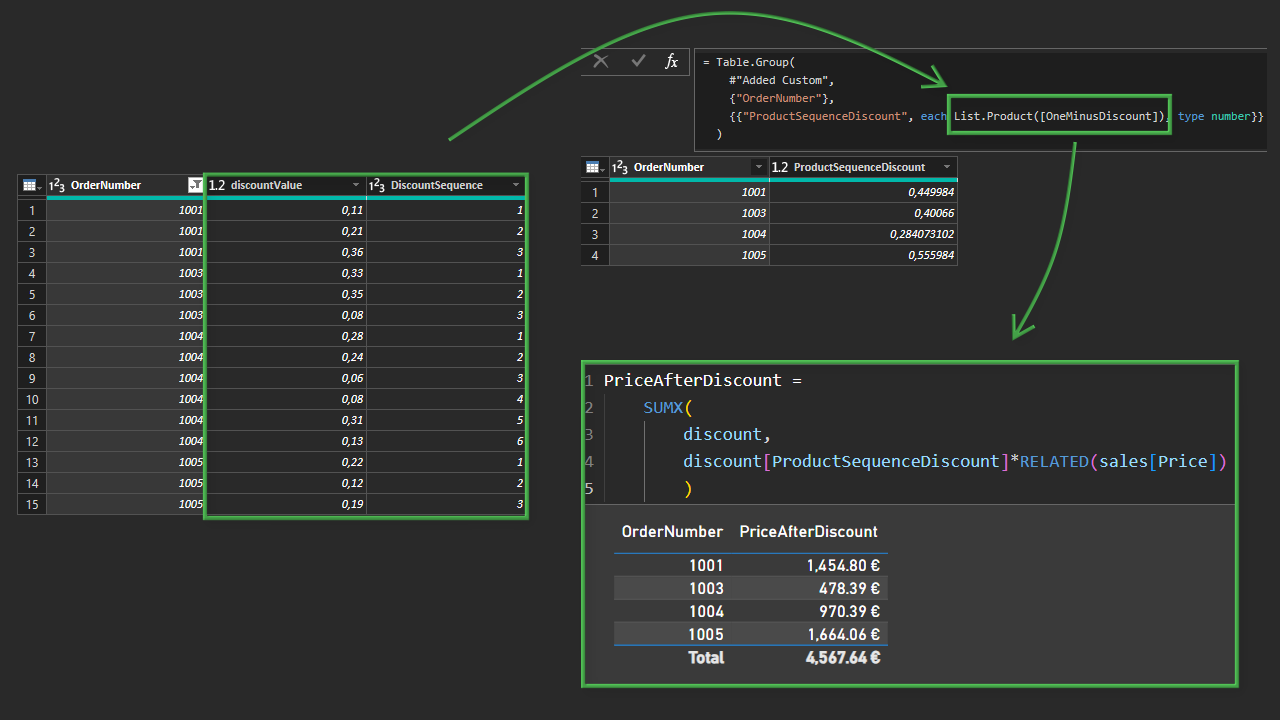
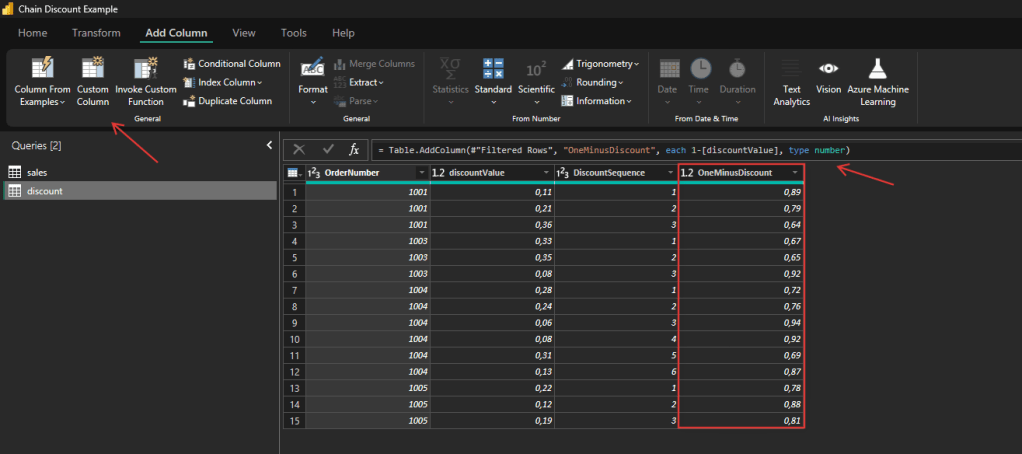
Now we can use Power Query to calculate the final price. First we need to calculate the ‘1-discount’, we do that by adding a new custom column and changing its type to decimal/number as shown in Image 3:
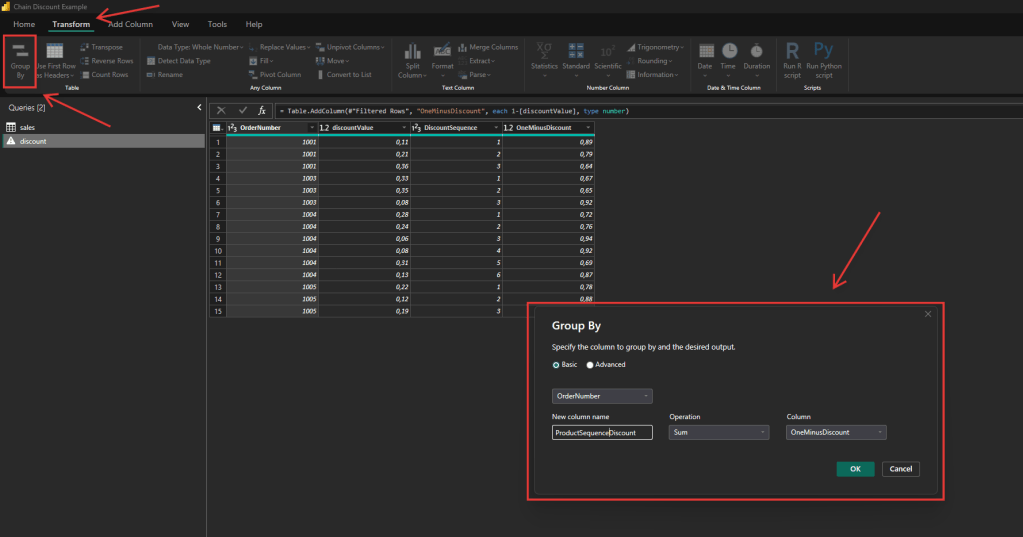
After adding the column, we can group the data by order number. The product (multiplication) isn’t available as a default aggregation in Power Query, but we can modify the generated code after.
The quickest way is to use the Group By option in the Transform tab, we can group by the OrderNumber column, and select the Sum operation for the OneMinusDiscount column (Image 4). This creates a new step, which we can then edit to use List.Product instead of List.Sum as shown in Image 5:
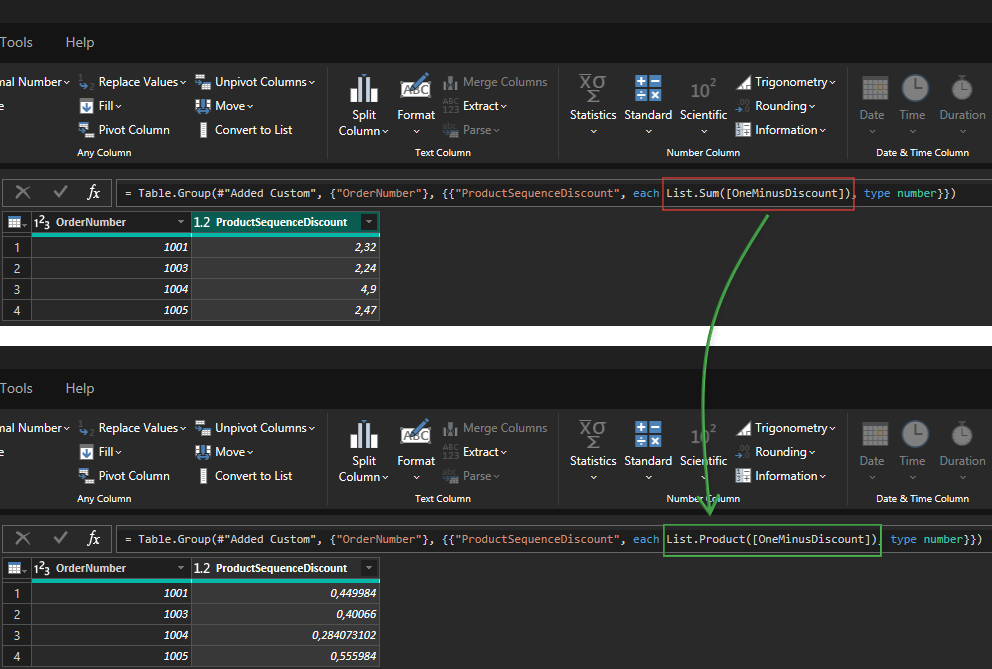
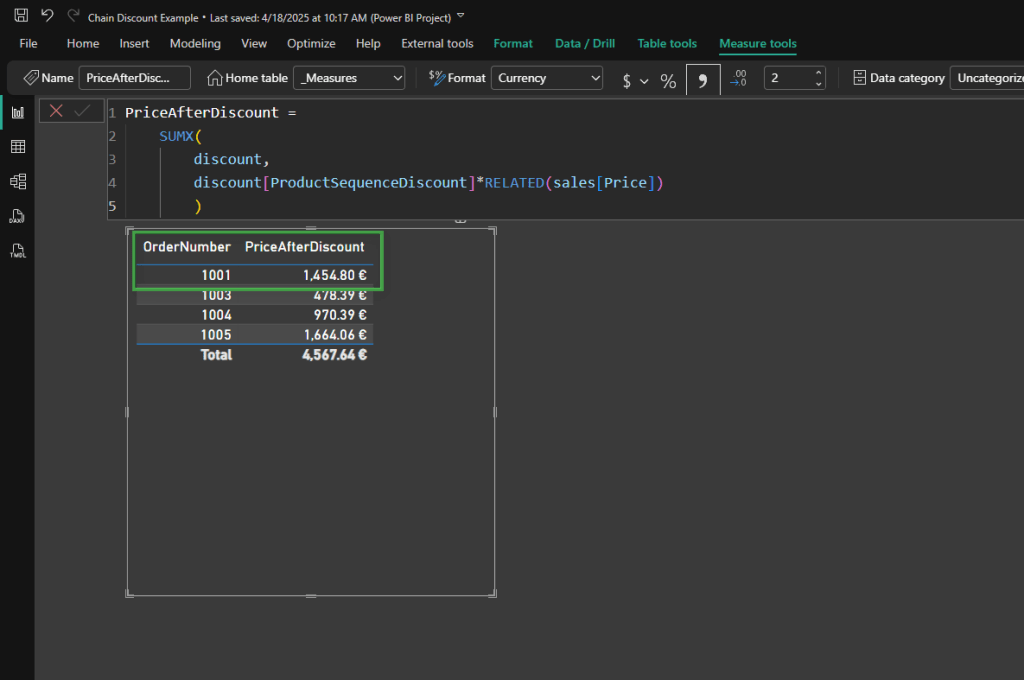
List.Sum with List.Product after using the group by option with the Sum operationAnd that’s it! We can now load the data into Power BI, create a relationship between the sales and discounts tables, and easily calculate the final price using a simple DAX expression, as shown in Image 6 below.
Conclusion
By converting a chain/series of discounts into a single product, Power Query can calculate the final price of each other with any number of discounts per into one simple step without referencing previous rows, this simplifies the query, and produces exactly the same results. The only downside is that you won’t have the intermediate prices between each discount.